Your Problem
As a Unisys ClearPath user you are looking for:
- A quick, concise overview of the status of your ClearPath mainframe
- The ability to receive alerts about operational situations that require your attention- especially when you are away from your office
- You are concerned that with fewer, less experienced operations personnel important ODT messages could be missed
- The ability to remotely monitor mainframe performance
- Assurance that "Lights Out" computer room operation won't delay response to critical operational situations
Our Solution
Our Performance Doctor software can address these needs and allow you to monitor your Unisys ClearPath MCP.
It monitors your system, graphically displays mainframe status and alerts you to problem conditions that could impact services - allowing you to quickly identify system bottlenecks.
Utilizing advanced yet easy to use features like Expert System technology, integrated advanced Alarm Management, Python Scripting, centralized audit logging, and a simple and intelligent Interface Performance Doctor solves your monitoring needs in one affordable, easy to use package.
Performance Doctor Features and Benefits
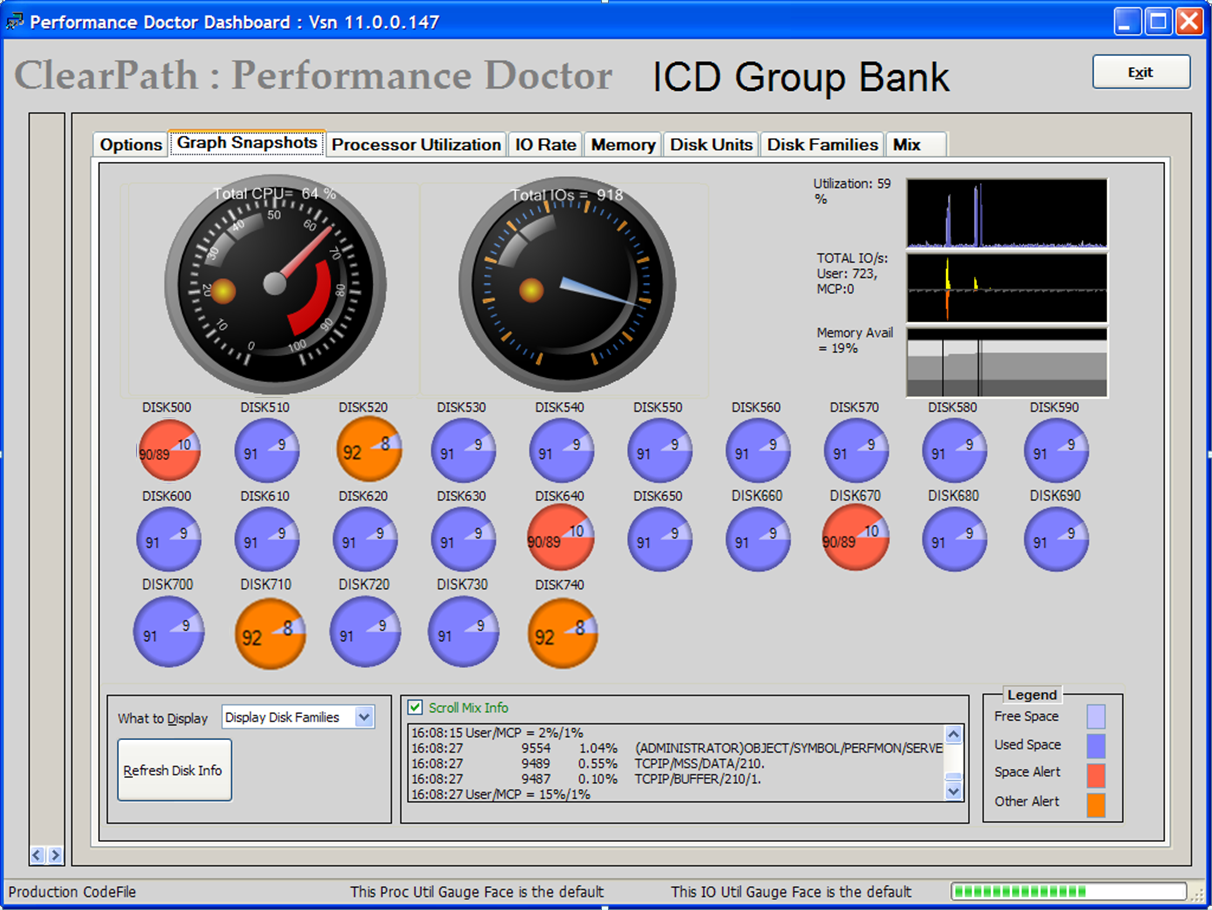
- Gauges show instantaneous CPU and IO activity allowing quick determination of critical metrics
- Color-coded pie charts and popup messages visually alert you to disk Unit and Family status
- Real-time and historical data are displayed on a single screen
- Visual, text and email alerts
- Identification of tasks using the most processor time
- Monitoring of your ClearPath from any Windows desktop
- Ability to drill down for details when necessary with just a mouse click
Using Performance Doctor
Performance Doctor's "dashboard" user interface (UI) gives you a picture of your CPU, IO, Memory and DISK status - all from the Snapshot screen.
Other screens show more detail:
- The Utilization and IO screens display both real-time and historical CPU and IO activity
- The Mix screen shows tasks that are currently active. Flexible filters allow you to display just the information you want.
- The Disk screen shows details such as available space, IOs/sec and Disk Queue length, etc.