
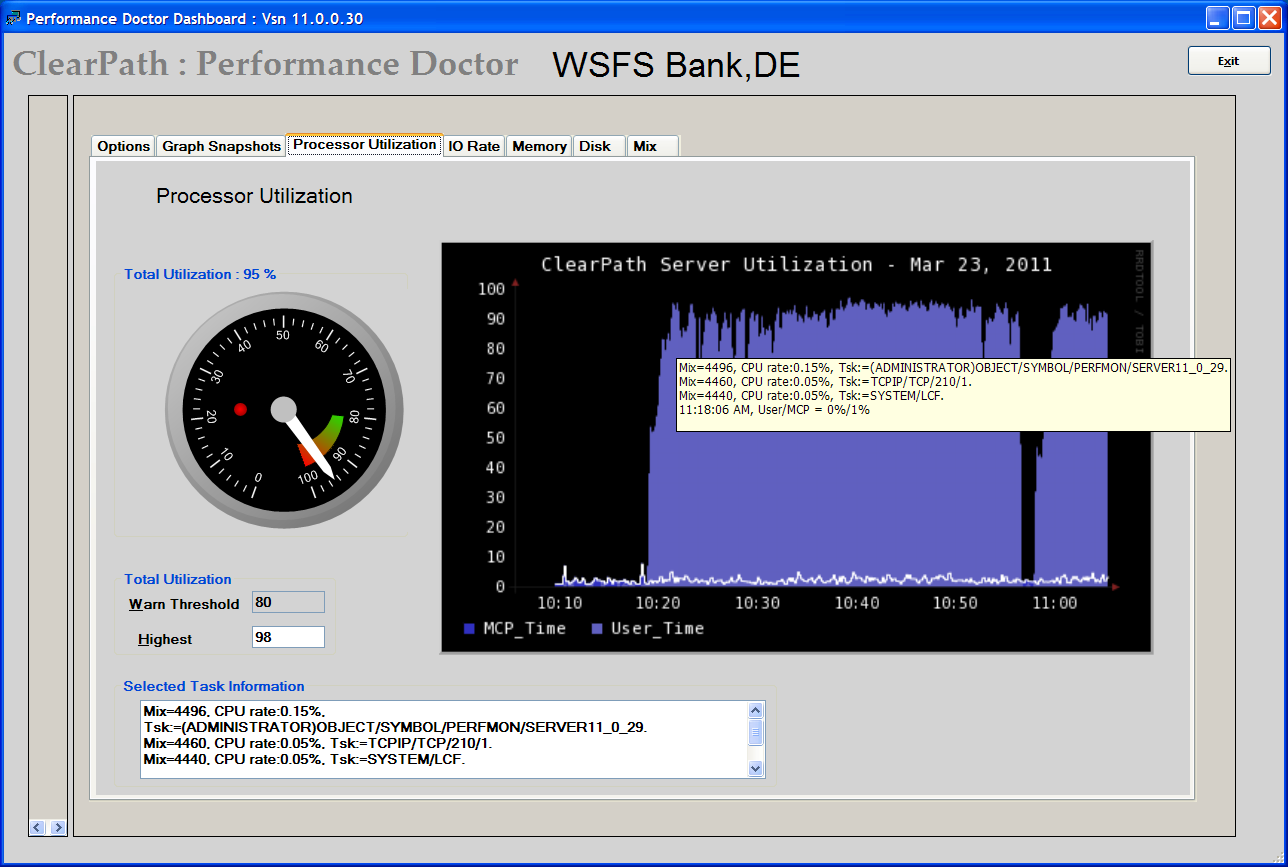
Performance Doctor displays three types of information about your ClearPath mainframe on the Utilization Screen:
As you mouse over the graph a pop-up window displays information about the top active tasks that correspond to these points on the history graph.
With a mouse click Performance Doctor copies the list to the Windows clipboard and also into the text box.
Any time you see an area of interest on the graph you can capture the information about the associated active tasks with just a mouse click.